Rules fixed before testing
STRATEGY INTELLIGENCE SYSTEM
From a trading idea
to an informed
decision.
Research crypto strategies, test their resilience and observe execution. Rules, data and results stay in one system.
FROM IDEA TO EVIDENCE / 02
Find a region of
stable settings.
Compare nearby parameter values. One successful combination does not show that an idea will survive a changing market.
FROM IDEA TO EVIDENCE / 03
Test the idea
on unseen data.
Reserve part of the history before selecting conditions. If the result disappears there, revisit the hypothesis.
FROM IDEA TO EVIDENCE / 04
Observe.
Without live orders.
Simulation applies the same rules to current markets. Review signals, trades and risk limits before considering live execution.
Research without a trading key. Live orders are your separate decision.
 kquantIllustrative example
STRATEGY PASSPORT / 01
BTC/ USDT · 1hFollow the trend
ENTRY
EMA 50 ↗ EMA 200
Fast moving average crosses above the slow averageTREND FILTERADX > 22
PROTECTIVE EXIT1.8 × ATR
The rule is defined.
Now it needs evidence.
02 / PARAMETER SEARCH
Look beyond a single point
Horizontal: EMA period. Vertical: ADX threshold. The light region illustrates stability across nearby settings, not measured returns.
Compare results and drawdown across the selected region.
03 / INDEPENDENT VALIDATION
Separate selection from testing
Select conditionsUnseen data
Fees and slippage included
Losses and drawdown visible in the report
A validation diagram, not a claim about strategy returns.
04 / SIMULATION
From signal to event log
- EMA 50 ↗ EMA 200Entry condition met
- ADX > 22Trend filter checked
- 1.8 × ATRProtective exit defined
- Simulated tradeNo live order is sent
01ONE STRATEGY. THE WHOLE JOURNEY.
Every result
has a reason.
Start with a clear hypothesis, such as a moving-average crossover. kquant keeps the conditions next to the result so you can understand what produced it.
- 01
Define the rule
Set entry, exit and risk rules before looking at the result.
- 02
Test on history
Inspect trades, drawdown and results after costs.
- 03
Challenge the result
Test other parameters, periods and unseen data.
- 04
Observe in Simulation
The same logic on current markets, without real orders.
02SEARCH AND SELECTION
Compare ideas.
Keep the reasons for your choice.
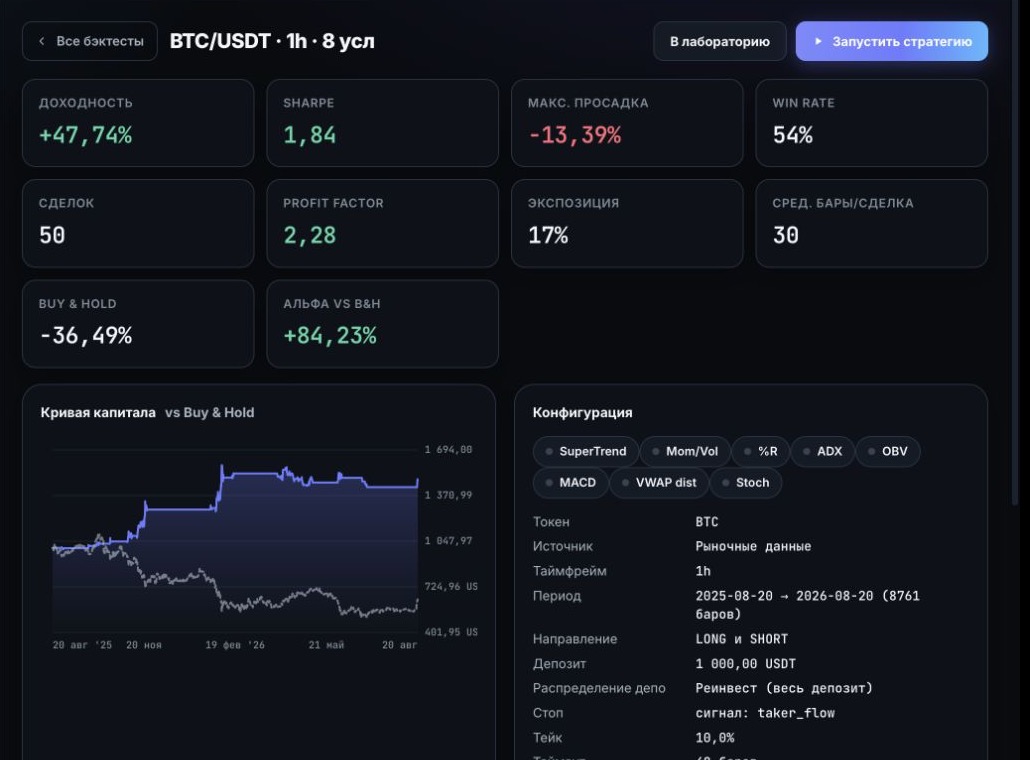
Start with your own rule or define an automated search: signals, periods and risk limits. Compare candidates by drawdown, costs and trade count as well as returns.
How automated search worksDefine the boundaries
Specify which conditions and parameter values the search may explore.
Compare nearby settings
Check how much the result changes when parameters move slightly.
Account for every attempt
More trials make chance success easier to find. Keep the search history for later validation.
03CHALLENGE THE EVIDENCE
A beautiful chart
is not enough.
After selection, find out whether the idea survives different conditions. A failed test is useful too: it lets you stop before taking real risk.
How validation worksHorizontal: EMA period. Vertical: ADX threshold. The light region illustrates stability across nearby settings, not measured returns.
Unseen data
Does the result hold on a period that was not used for selection?
Nearby parameters
Does a region work, or only one lucky combination?
Higher trading costs
What remains when fees and slippage increase?
Example: validation failed
The result disappeared on unseen data. Revisit the hypothesis before moving to execution.
STRATEGY PASSPORTIllustrative schemaFollow the trend
BTC / USDT · 1h · EMA + ADX + ATR
- Rules
- Entry · filter · exit
- Assumptions
- Data · costs
- Validation
- Periods · parameters
- Execution
- Events · trades · reconciliation
One decision history
04KEEP THE CONTEXT
Keep the result.
And the reason behind it.
The Passport connects strategy logic, assumptions, validation and execution events. Return to the research knowing what you tested and why you made the decision.
Explore the Strategy Passport05TWO SCALES OF RESEARCH
One asset.
Or a whole portfolio.
 BTC / USDT
Single-asset strategy
Build entry and exit conditions for one instrument. Explore when the rule works and when it stops working.
Explore a trading rule

 + n
+ nMulti-asset strategy
Compare relative strength, build baskets and allocate risk. Evaluate the portfolio as a whole.
Explore portfolio research06CONTROLLED EXECUTION
The next step
is your decision.
Observe in Simulation first. Available live execution requires a separate exchange connection, your capital, configured limits and a pre-launch check.
Security and controlsNo withdrawal permission
The access key does not require withdrawal permission.
Limits before launch
Position size and loss limits are configured in advance.
History and reconciliation
Signals and fills are recorded for comparison with the exchange.
07CLEAR TERMS
Start
with research.
No fixed subscription. Explore the system and test your hypothesis before deciding on live trading.
Open beta
Each month includes 100 USDT of virtual credit for service fees. This is not trading capital: it cannot be topped up or withdrawn.
Research and SimulationNo subscription
10%
of the positive result of each closed live trade
Calendar month cap100 USDT
No service fee on flat or losing trades. Exchange fees are separate.
How fees are calculatedDo I need to code?
The Laboratory does not require code. Select conditions and parameters in the interface. You still need to understand the strategy and its risks.
Do I need an exchange key to start?
Historical research and Simulation do not require a trading key. Connecting an exchange is a separate step for live execution.
What happens after registration?
Verify your email, open the Laboratory, and choose an asset and conditions. Your first result shows trades, costs and changes in capital. Registration does not start live trading.
Does a successful test guarantee profit?
No. Historical and statistical tests describe past data and resilience to specific challenges. Future markets can produce losses. Simulation follows historical testing; live execution is a separate decision.
How does beta billing work?
Research is available without a subscription. At the start of each UTC month, the internal wallet receives 100 USDT in virtual beta credit for service fees. This credit cannot be topped up or withdrawn. Live trade fee rules are explained on the pricing page.
TURN AN IDEA INTO RESEARCH
Test your
next idea.
Open the Laboratory Historical results do not guarantee future performance.